


Abstract
Regulations that govern oversight of seclusion and/or restraint episodes (SREs) in the United States are relatively uniform and may assume that such events are normally distributed within the population generating them. This study illustrates that the distribution of patients who required one or more SREs within one state psychiatric hospital setting is heavy-tailed—that is, a small group of patients generated a disproportionate majority of the events: 20 percent of patients with the most SREs accounted for approximately 75 percent of the total number of SREs; 10 percent of patients accounted for 61 percent, and 1 percent of patients accounted for 21 percent. Characteristic features of heavy-tailed distributions are described and discussed in relation to the feasibility of eliminating SREs in mental health settings and the governance of SREs by uniform regulations. Attempts are made to model and subtype the distribution, and commentary is made as to potential clinical and policy relevance of the findings.
… far from having lost his strength, Ahab, to that one end, did now possess a thousand fold more potency than ever he had sanely brought to bear upon any one reasonable object.—Herman Melville (Ref. 1, p 182)
A longstanding mandate in mental health settings has been to restrict the use of seclusion and/or restraint to exigent situations, typically when less intrusive means have failed to deter patient aggression toward self or others. Although historically inconsistent in application and potentially subject to misuse, the progenitor of this delimitation was described and widely disseminated as early as the 13th century2 and then refined by Pinel3 in the 18th century. In the early to mid-19th century, increasing oversight and regulation accompanied the intervention—for example, at the Lincoln Asylum: The attendants are required to report to the House Surgeon whenever any patient is held by the hands as much as ten minutes; and if he direct the holding to be continued, the fact must be entered into the “Register of Control” … and marks (if any) found upon their persons shall be reported in the Daily Return of the State of the Patients’ forthwith to the Board [Ref. 4, p 354].
Currently, to maintain accreditation, psychiatric hospitals in the United States must adhere to standards and regulations related to the use of seclusion and restraint. For example, as a condition of participation, the Center for Medicare and Medicaid Services requires training, reporting, and various codified procedures coincident with a seclusion and/or restraint episode (SRE), such as practitioner evaluation within one hour, reassessment at short intervals, and continuous monitoring by the staff.
Maximum reduction or elimination of SREs, an intended goal of public psychiatric hospitals,5 has historically been difficult to achieve. A recent letter to Psychiatric Services reported that the current climate to eliminate SREs is “laudable in idealism but lacking in clinical reality” (Ref. 6, p 576). This statement is similar in tenor to an admonition by Isaac Ray, MD, who in 1855 noted that various advocates of (mechanical) nonrestraint “place themselves upon higher ground than practical expediency,” and that their opposition to such appeared “more the extravagant expression of warm and earnest feelings than the result of careful experiment or extensive observation” (Ref. 7, p 384). In addition, the ancestors of the current relevant concerns, challenges, controversies, and governances related to SREs, albeit denominated in the parlance of the era, appeared already venerable by 1883, as noted in the Medical Times and Gazette.8
The primary purpose of this study was to obtain a gross statistical distribution of patients who required one or more SREs in the setting of a state psychiatric hospital. It seems important to classify the distribution of SREs, both to understand the phenomena better and to inform policies regulating their oversight. Given research findings on both inpatient violence9–11 and the use of as-needed medication,12 which suggest that a relatively small subpopulation of patients typically generate a disproportionate majority of events, it was hypothesized that the SRE distribution would be highly skewed.13 Of particular interest was whether the results could be classified as heavy-tailed, which describes several types of statistical distributions, including power-law and stretched-exponential (the former are sometimes referred to as 80-20 laws, wherein 20% of subjects account for 80% of effect and are defined by a straight line when the cumulative distribution is plotted on a double logarithmic scale).14,15 A commonly cited example is that no one would be surprised to find a person several hundred meters tall if the length of humans exhibited a heavy-tailed distribution (while retaining the same mean length as humans have in reality).
Heavy-tailed distributions are interesting for a variety of reasons. For example, the frequency distribution is characteristically dominated by a few individuals exhibiting large values of a property, and the concept of an average has little meaning because removing an average individual from the population has very little overall effect (described in Discussion as robustness), while removing those few individuals with a large number of SREs significantly decreases the average numbers of SREs (described in Discussion as vulnerability).14,15 In addition, these distributions can arise in complex systems characterized by growth within the network—in this case, new patient admissions to the hospital, and a positive feedback (rich-get-richer) effect, termed preferential attachment.14,15
Methods
This retrospective study was conducted pursuant to approval by the Institutional Review Board of the Utah Department of Human Services. The Utah State Hospital (USH), located in the foothills of the Wasatch Mountains, is a 354-bed facility that remains the only state psychiatric hospital in Utah since it was established in 1885. It has various units dedicated to the treatment needs of children, adolescents, and adults with severe mental illness, including a 96-bed forensic unit. The hospital has been continuously approved by accrediting bodies, consistently records details of SREs, assiduously strives to minimize their occurrence through less restrictive alternatives and a variety of other interventions, and typically runs at or below the national average for these incidents relative to other state hospitals that participate in The National Association of State Mental Health Program Directors, especially in terms of total time spent in seclusion or restraint (unpublished administrative data).
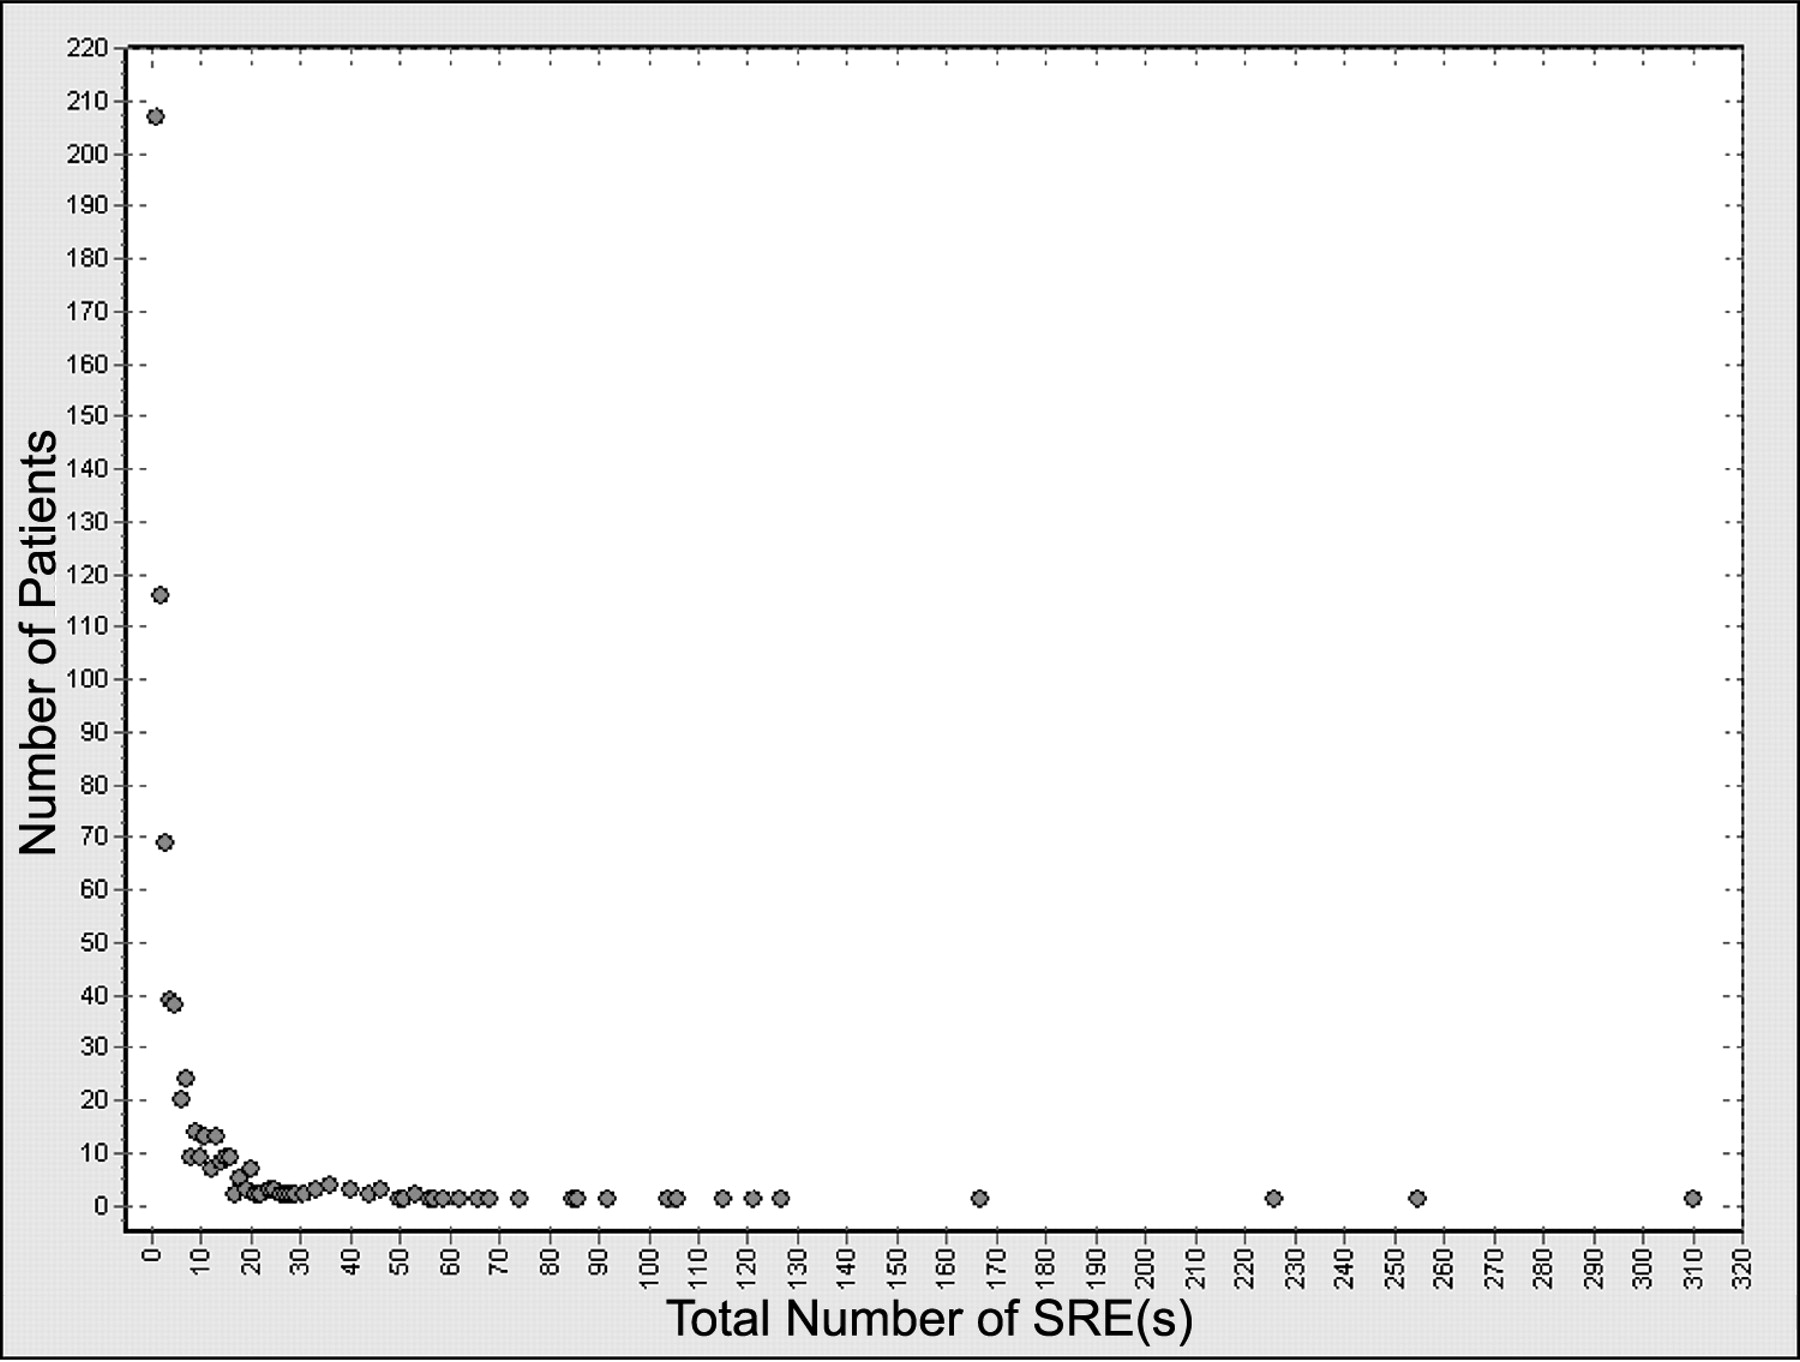
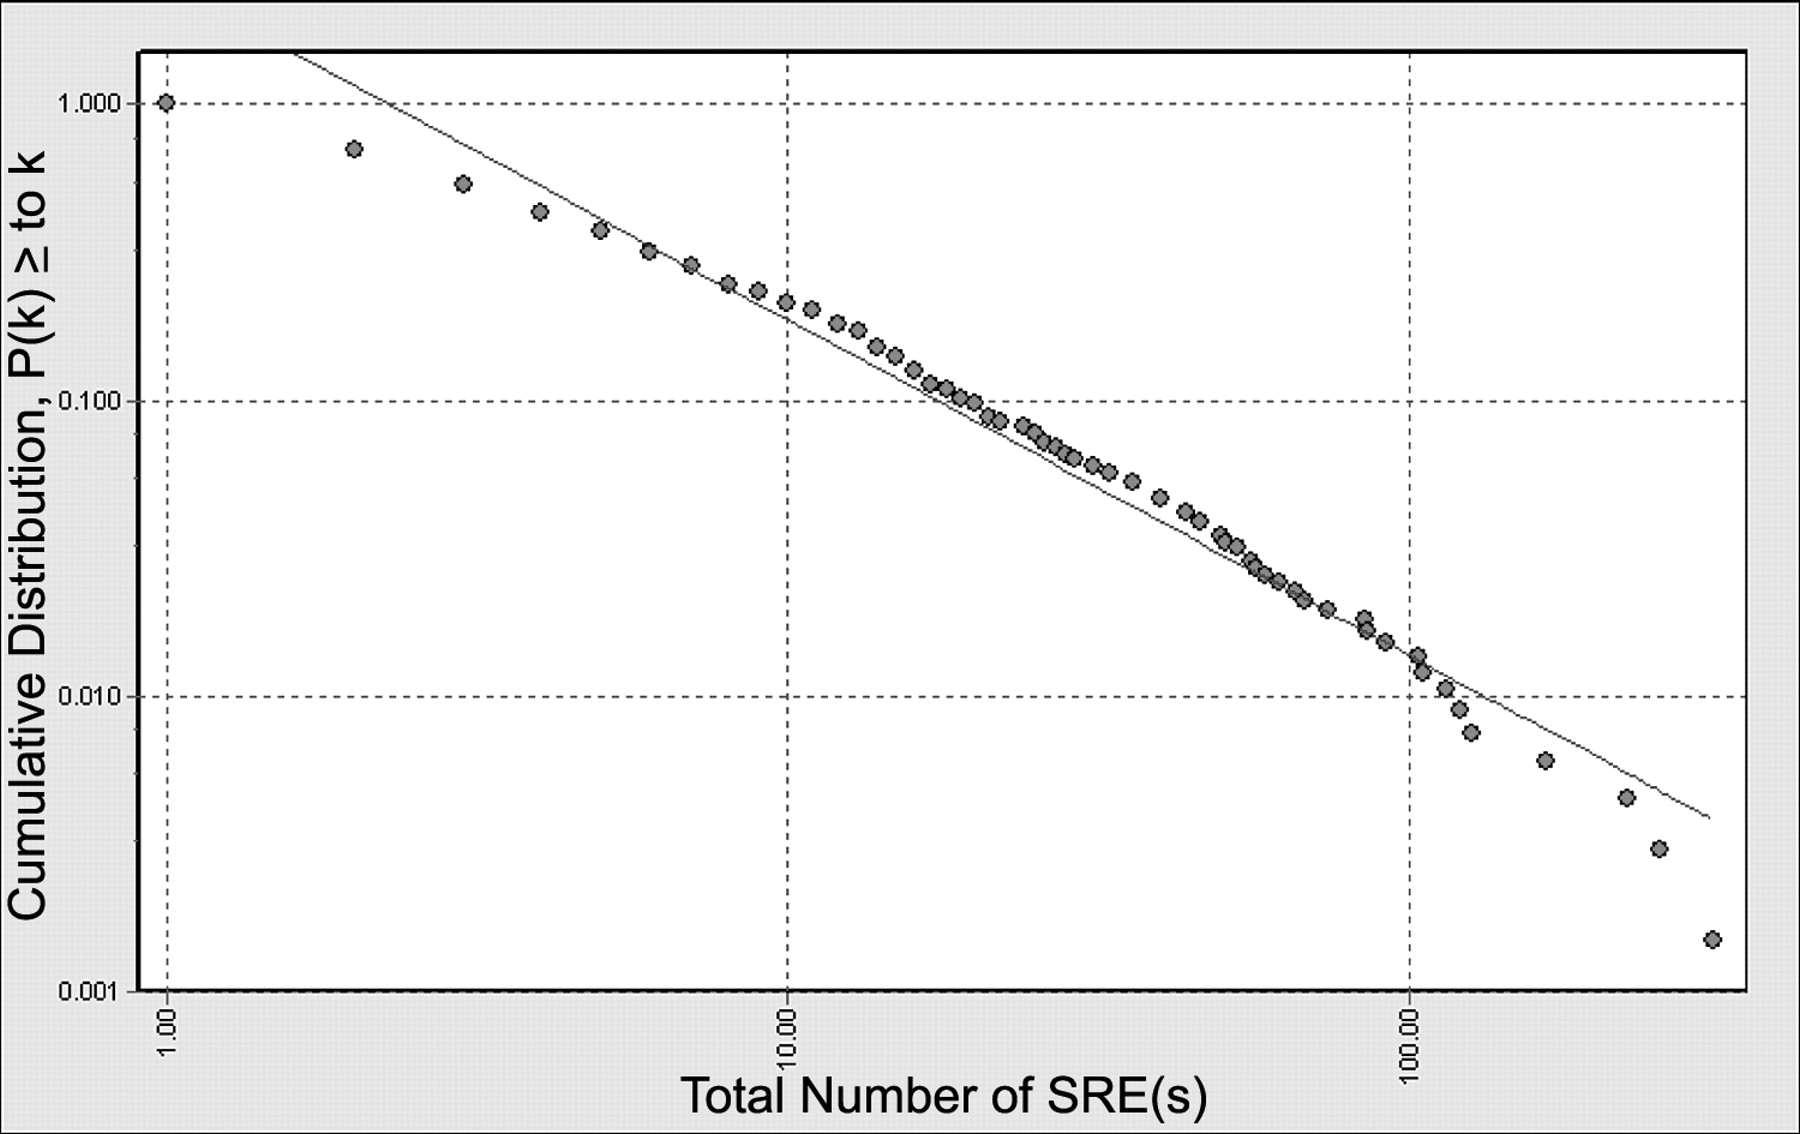
All SREs that occurred at USH between September 1, 1997, and March 1, 2005, were extracted from the electronic medical record. The beginning date corresponded to the advent of reliable documentation in the electronic (versus paper) medical record; the ending date corresponded to submission of this study for approval by the Institutional Review Board. Total hospital SREs and number of SREs per patient were counted. Median and mean number of SREs were calculated, and the total number of patients with {1, 2, …, or k} SREs was plotted (Fig. 1). As the telltale sign of a power law is slope linearity on a double-logarithmic cumulative plot,13,15 the total number of SREs was then plotted against probability, and a best-fit power-law equation was obtained by using graphing software (Fig. 2).16 To test whether a power-law accurately modeled the data, the slope of the fitted power-law equation was then further analyzed to assess for linearity, using a bootstrapping method (Fig. 3). Several variables for those patients with the highest number of SREs were then examined, such as diagnosis and length of stay. Patients with excessive SREs were considered hub patients (HPs).

The number of patients with k total seclusions is a rapidly decaying curve, wherein multiple small events coexist with a few relatively large events: 207 patients required 1 SRE, while one patient required 310 SREs (34 times the mean). In contrast to a normal, or bell-shaped, distribution, there was no peak at an average or typical value, and the distribution was highly right-skewed, denoting the existence of hubs.

A double-logarithmic cumulative plot, p(k) ≥ k of the data (circles). The accompanying line shows the best-fit power-law function in the form p(k) = Ck−a for the distribution between a minimum of one to a maximum of 310 SREs.

Illustration of how the estimated power-law function slope exponent a changes up to a maximum of 100 SREs when fitting the slope via a maximum-likelihood procedure, with bootstrapping for 95 percent confidence intervals. As it deviates from a straight line, a power-law type of heavy distribution is ruled out; a stretched-exponential function may better account for the data.
Results
During approximately 7.5 years, 679 inpatients required at least one SRE and accumulated a total of 6,223. No fatalities or serious injuries were noted in the record. The median number of SREs for those patients who were secluded and/or restrained at least once was 3, the mean was 9.2, and the standard deviation 23.4. In the analysis, the 20 percent of patients with the most SREs accounted for approximately 75 percent of the total number; 10 percent of patients accounted for 61 percent, and 1 percent for 21 percent. These findings are consistent with the initial aspect of the hypothesis, and denote significant skew in the distribution of SREs, wherein numerous small events coexist with a few large hub events, the latter of which primarily define the distribution.
As illustrated in Figure 1, in contrast to a normal bell-shaped distribution or an exponential distribution,13 the number of patients with k total seclusions is a rapidly decaying curve consistent with a heavy-tailed distribution, wherein multiple small events coexist with a few relatively large events. For example, 207 patients required one SRE throughout their hospitalizations and 116 patients required two, while in the right tail of the graph, 1 patient required 310 SREs, which was 34 times the mean value.
Figure 2 is a double-logarithmic cumulative plot of the data, which would be expected to follow a straight line if described by a power-law. The accompanying line is the modeled power-law function in the form p(k) = Ck−a. In concrete terms, this model denotes what percentage of patients secluded/restrained one or more times required at least k number of SREs. Over a limited range of values, the power-law equation provides a reasonably close agreement between modeled estimate and actual data; for example, both would denote that approximately two percent of patients (14 of the 679 who were secluded or restrained at least once) required 68 or more SREs. (More detailed information is available upon request.) However, the modeled power law clearly does not linearly follow the actual data, ruling out a power-law subtype of a heavy-tailed distribution. Figure 3 illustrates how the slope exponent a of the modeled power-law function changes up to a maximum of 100 SREs via a maximum-likelihood procedure, with bootstrapping for 95 percent confidence intervals. Rather than exhibiting a truly straight line, the slope of the actual data appears to increase over the whole interval, which is better accounted for in a stretched-exponential function (a function with a heavier tail than an exponential distribution but a less heavy tail than a power-law distribution, may therefore more accurately model the data).
Of the 15 HPs represented by points in the far right tail of the distribution in Figure 1, 11 uniformly included diagnoses of either borderline personality disorder or reactive attachment disorder among their various diagnoses, including the four heaviest utilizers of seclusion or restraint. None of the HPs was a forensic patient or appeared to have unusually long lengths of stay relative to those with fewer seclusions. However, any discriminating data related to HPs relative to other patients remains preliminary and tentative, pending further characterization.
Discussion
Various biological and social systems have highly skewed distributions.15 Several examples of heavy-tailed distributions include cumulative distribution of sizes of cities in the world, total wealth (i.e., most wealth is held by few individuals), and the number of occurrences of words in the novel Moby Dick.13 A study of the network of sexual relationships among people in Sweden,17 later replicated in other settings, found that either over the course of their lives or over relatively short amounts of time, most people had relatively few partners, but that some had dramatically more; this network had a highly skewed, power-law-like distribution wherein very large values—up to 50 times the mean—were observed.
Characteristic features of heavy-tailed distributions—such as robustness and vulnerability, and variables within some networks hypothesized to generate them—such as growth within the network and preferential attachment have been described (Ref. 15, pp 64–6). The latter variable is also thought to have a competitive element of fitness and to drive a positive-feedback, rich-get-richer phenomenon (Ref. 14, pp 79–92, 95) and has been described as the Matthew effect in sociology18 and as increasing return in economics.19
Robustness of the SRE data is suggested by the sobering finding that even if 99 percent of patients within the distribution had somehow been prevented from having the SREs, hypothetically over 20 percent of all total events could still be generated. In other words, the mathematical architecture of the distribution, if typical of other hospitals, might help explain why the task of reducing the frequency of SREs has historically been difficult and challenges the feasibility of eliminating their occurrence.5 In addition, the top 1 percent of patients secluded who accounted for over 20 percent of all such events, represented a miniscule fraction of all hospital admissions during the study period (i.e., total population, including those not secluded or restrained). In concrete terms, nearly 9,987 of 10,000 total inpatients could be completely free of seclusion and/or restraint, and a hospital could still accumulate over 20 percent of total SREs.
Vulnerability of the network, the linchpin to effective reduction of total numbers of these events, is suggested by the potential ability to identify, address selectively, and deconstruct clinically the variables related to HPs, perhaps by virtue of addressing common themes in pathology process or its management, critically assessing the need for inpatient hospitalization, developing highly individualized but consistent treatment approaches, implementing a process for identifying critical cases and initiating a clinical and administrative case review,20 and maximizing awareness of contributory dynamics within the hospital environment. Also illustrated is the potential to dramatically reduce total SREs by discharge or transfer of HPs. A potentially troubling consequence is that transfer of a select few patients into correctional settings subsequent to their violent behavior, where seclusion is the norm rather than the exception, could dramatically reduce a hospital's apparent SRE totals. For example, via the singular intervention of discharging or transferring only seven patients over the study time period, total hospital SREs hypothetically would have been reduced by over 20 percent.
Although not explicitly stated as such, current regulations that govern use of SREs appear to address the question as if there were a typical or average SRE from a relatively homogeneous, normally distributed population. Current policies appear to address well most of the patients who require SRE, but aspects may not be well suited for patients who generate most SREs themselves, especially if some patients with excessive SREs have relatively entrenched vulnerabilities toward indiscriminate or pathological attachments (i.e., as reflected in diagnoses such as borderline personality disorder or reactive attachment disorder). Extension of an analogy frequently cited in network literature (Ref. 15, p 63) may serve to illustrate the shortcomings of this approach: Standardized dietary policies work relatively well for a population normally distributed for body size, but would quickly founder if sizes could also range up to 34 times the mean value (i.e., 187 feet tall).
In addition to growth (i.e., new admissions) within the network, several mechanisms may serve as hypotheses for the SRE distribution:
a process similar to preferential attachment (i.e., if the probability for an incident increases with the number of previous incidents, typically a power-law or stretched-exponential distribution results, the latter if the probability increases slower than linearly)21;
a significant variation in hospital stay or between different diagnoses;
or a large variation in some other unknown.
Further characterization of the data might assess whether a preferential attachment mechanism is somehow bound up in clinical phenomena characteristic of patients with diagnoses such as borderline personality disorder or reactive attachment disorder. Unlike most social networks, variables within the SRE network can theoretically be defined and enumerated (e.g., amount of time between SREs for each patient, total duration of hospital stay, diagnoses, and specific staff responding to an SRE). Further characterization of SRE networks, as well as similar cumulative plots between genders, ages, diagnoses, and time frames, are potential areas of future research. In addition, a general framework for statistical inferences for a preferential attachment process has been developed22,23 and can be tested, once further data are obtained from the SRE population, such as time between events. Of interest is the anecdotal and tentative clinical impression that HPs do not appear necessarily to have poor clinical outcomes, suggesting the possibility of an adaptive mechanism at work in what appears otherwise to be morbidly dysfunctional behavior.
While maximum efforts should be continuously employed to minimize the occurrence of SREs in lieu of less restrictive alternatives, their occurrence should not be summarily dismissed as universally retraumatizing, avoidable, illustrative of treatment failure or staff retribution, or easily remedied by increased training or augmented treatment modalities.
SREs trigger numerous clinical questions in their heavy utilizers. Are they a form of deliberate self-harm which coerces connection and serves a regulatory or communicative function? Is there an adaptive mechanism at work, ostensibly to form a broad and indiscriminate network of attachments in light of perceived absence of stable attachments and competition for limited resources? Does seclusion or restraint present a compromise solution to the dilemma involving both rage and terror of either abandonment or closeness? Does an SRE approach the status of an independent object relation for heavy utilizers? Is it best to maintain HPs on the same treatment units or to split them among the units? Do procedures related to governance of SREs inadvertently reinforce in some patients that which they purport to safeguard and minimize, and should the policy approach be the same for HPs as that for most patients who require few SREs? Are those individuals who accrue few SREs paradoxically more at risk of experiencing the intervention as traumatic and in this respect more in need of regulations and governance than HPs?
It is the primary author's opinion that SREs in HPs often carry an unnerving sense of inevitability despite preemptive treatment interventions, that their presence has clinical meaning and should intrinsically be part of the clinical work (both toward patients and staff), and that their situational precipitants are more often the product of latent process than manifest content—perhaps not unlike Captain Ahab, who, “gnawed within and scorched without, with the infixed, unrelenting fangs of some incurable idea” (Ref. 1, p 183), tenaciously sought a situation and people by which to mourn, redeem, and avenge a lost object. SREs in HPs accrete at the confluence of difficult clinical concerns, involving the value of prolonged inpatient hospitalization for chronically self-harmful patients,24 enactment of splitting defenses via the process of diffuse networking, and the difficulties of remaining consistent given the involvement of numerous staff and providers. Another challenge is found in the emotions that are potentially activated or induced in staff and providers undertaking the difficult work of treating or safeguarding HPs. Staff may become, not unlike the crew of the Pequod toward Ahab: … packed by some infernal fatality to help him in his monomaniac revenge. How it was that they so aboundingly responded to the old man's ire, by what … magic their souls were possessed, that at times his hate seemed almost theirs [Ref. 1, p 184].
Multiple limitations accompany this study and several require comment. The findings may be unique and coincidental to this hospital setting. The total distribution of diagnoses is not as yet known and diagnostic bias may accompany HPs. The many moving targets and variables that contribute to SREs are not controlled. It was assumed that SRE interventions over time are relatively constant, when in fact they are often in flux, and methodology does not draw attention to the other variables that affect frequency of SREs toward any one patient, especially whether certain staff respond in inflexible and stereotyped ways. In addition, the various interventions that fall just short of an actual SRE, which render SREs as underestimates of actual violent episodes, are not included, and individualized assertive clinical efforts toward HPs are not controlled for. Finally, this study is not an exhaustive mathematical analysis, but is a preliminary and general overview toward a potential organizing principle, if even by virtue of useful analogy, to an otherwise complex, large-scale, and historically intransigent phenomenon. It is of interest, however, that recent SRE research findings appear to reflect a skewed distribution.25
Conclusions
The distribution of SREs in a particular state hospital exhibits a highly skewed, heavy-tailed distribution over a broad range, where the 20 percent of patients with the most SREs accounted for approximately 75 percent of the total number of SREs and HPs appear to dominate. The current distribution appears more consistent with a stretched-exponential function than a power-law and would require replication in other hospital settings to have any broader relevance, but merits further subclassification and analysis. The relevant mathematical function(s) potentially governing SRE distributions seem important to classify, to better conceptualize variables that may converge to create the distribution.
In a tentative sense, lessons learned from the study of skewed distributions may have application toward understanding clinical aspects of SREs, conceptualizing the behavior of a complex and dynamic system such as an inpatient setting of a state hospital, informing policies and procedures governing SRE oversight, and suggesting areas of future research. Overly simplified variables, such as growth, and a preferential attachment mechanism may have relevant analogies in both hospital environment and process of pathology which, in conjunction with the existing literature, supplement an understanding of SRE phenomena. Finally, viewing the distribution as skewed, robust, and vulnerable14 may provide useful adages that square with common clinical experience and help inform attempts to maximally reduce, but likely never eliminate, SREs.
Footnotes
-
Disclosures of financial or other potential conflicts of interest: None.
- American Academy of Psychiatry and the Law


