


Abstract
Previous studies aiming to establish a correlation between schizophrenia (SCZ) and aggressive behavior have resulted in contradictory results. Despite this, a certain degree of evidence suggests a potential underlying genetic component to aggression in SCZ. Polygenic risk score (PRS) analysis is a novel technique to estimate the combined effect of multiple genetic influences on aggression. Our objective was to investigate whether PRS could determine a proclivity toward aggressive behavior in patients with SCZ. Community-dwelling patients diagnosed with a schizophrenia spectrum disorder (n = 205) were recruited from a nonforensic outpatient sample. Participants were assessed for aggression using a cross-sectional and retrospective design, and PRS was calculated using genomic DNA and the Illumina Omni 2.5 array. We did not detect any associations between lifetime physical aggression (P = .32), verbal aggression (P = .24), or aggression against property (P = .24) and the PRS for SCZ risk. There may be several reasons to explain our null findings. We recommend that future interaction analyses of PRSs in SCZ that investigate violence focus on forensic psychiatric patients with higher base rates of violence and use participant interviews to assess aggression.
Schizophrenia (SCZ) is a severe, complex psychiatric disorder encompassing positive, negative, and cognitive symptoms. Because of the interaction among several proximal and distal risk factors, especially the presence of positive symptoms (e.g., paranoia, delusions, hallucinations),1 increased risk of aggression has been observed in SCZ compared with the general population, especially when personality disorders and substance misuse are also present.2,3
The association between violence and SCZ has previously been examined by several investigations utilizing different study designs.2,4,–,7 Previous studies have found that patients with SCZ are three to four times more likely to be convicted of a violent offense4 and are also at higher risk of committing homicide compared with the general population.5 Other studies have analyzed verbal aggression in schizophrenia, and found it to have an inverse correlation with the severity of negative symptoms.8
In contrast to the aforementioned studies, the seminal MacArthur Risk Assessment Studies found little to no correlation between the presence of a SCZ diagnosis and increased rates of violence or aggression in a population of patients discharged from an inpatient hospitalization and followed in the community for one year.6 It was also determined that rates of violence were instead exacerbated in individuals with a substance use disorder (SUD).6 In addition, this study was replicated in 2009 by researchers from the University of North Carolina Forensic Psychiatry program. The results corroborated the previous finding that the presence of an SUD was the main causal factor of increased levels of aggression or violent behavior in the examined population.7 SUDs have also been implicated in increased aggression in a study conducted by Fazal et al., which noted that the increased rates of aggression or violence that were seen in patients with SCZ could be attributed to the presence of an SUD rather than the diagnosis of SCZ itself.5 Despite these findings, violent and aggressive behavior is often associated with individuals diagnosed with SCZ and results in further stigmatization of this population.9
Importantly, the aggressive behavior of some patients with SCZ is a public health problem, and pharmacological and nonpharmacological interventions should be used to treat not only aggression, but also substance use and personality disorder comorbidity.10 Therefore, additional research is needed to better understand the potential biological factors contributing to aggression in SCZ to help develop more effective interventions for violence, which would hopefully have the effect of reducing stigma.
To determine the cause of aggression in SCZ, researchers have reported several clinical risk factors11,12 that increase proclivity for aggression in SCZ, including male sex, childhood physical and sexual abuse, substance abuse, and lower socioeconomic status.13 Hostility and anger, which typically refer to the cognitive and emotional aspects of aggression, have also been found to precede acts of violence in SCZ.14 For patients with SCZ, anger as a consequence of delusional beliefs, particularly those involving threat or harm, has been linked to psychosis and violence.8,15 The relationship between genetic background and violent behavior has mainly focused on serotonergic and catecholaminergic genes, as these systems are thought to be highly involved in leading theories exploring the neurobiology of aggression.16 Focusing specifically on aggression in SCZ, our group previously explored the relationship between aggression and genetic risk loci at a genome-wide level in patients with SCZ and found that a single nucleotide polymorphism (SNP), rs2188177, on chromosome 7, showed a trend for association with physical violence (P = 7.80E-06) in this population.17 Considering the small sample size of this genome-wide association study (GWAS), however, our results should be considered preliminary and a firm conclusion about the role of the SNP rs2188177 cannot be established.
Although our study was the first to explore the relationship between SNPs and aggression in SCZ, the relationship between genetics and violent behavior in SCZ remains unclear. Therefore, to follow up on these results and further elucidate the link between genetic background and aggression, we investigated the association between polygenic risk score (PRS) and aggression in SCZ. We hypothesized that PRSs would be predictive of physical aggression, verbal aggression, and aggression against property.
PRS is a technique often employed in genetics studies as a means to determine individual predisposition to disease through the aggregation of trait-associated alleles across many genetic loci to form a single score.18,19 The calculation of PRS is most commonly conducted through the summation of risk alleles, with the effect size of a given SNP being determined through GWAS data.19,20 These risk scores offer a unique approach to utilizing the predictive power of genome-wide association findings and applying them to a clinically relevant phenotype. As a relatively novel technique, there are minimal guidelines regarding the best methods to conduct PRS and analyze PRS results.21 As this technique becomes increasingly popular, however, literature regarding best practices continues to be produced. Currently, PRS is one of the only existing techniques that allows for prediction of the genetic liability of traits at the individual level.21 Thus, there is potential for future use of PRS in clinical settings, as a means of providing preventive health care measures to individuals that are genetically predisposed to disease.19,22 Despite the benefits of PRS, it is not without its drawbacks, as its utilization in the clinical setting can also lead to possible misdiagnosis.22 Another drawback is the potential inequitable availability of the technique in clinical settings, with the resource only being available to select socioeconomic groups.22
The application of PRS has become routine analysis in psychiatric genetics. Among a range of applications, PRSs are exploited to assess shared etiology between phenotypes, to evaluate the predictive power of genetic data for use in clinical settings, and as part of experimental studies in which, for example, experiments are performed on individuals or their biological samples.21
Regarding studies of PRS and aggressive behavior, Musci et al.23 found that the polygenic scores of conduct disorder may interact with violence exposure in determining more impulsive and aggressive phenotypes.23 PRS has been established to improve the statistical power and applied in the GWAS as a robust analytic tool. Although PRS has potential predictive ability, its use at present remains limited to research for behavioral phenotypes.24
Along with PRS utilization as a disease prediction tool, it has also previously been implemented in determining individual predisposition to characteristics that are thought to have a genetic component, one of which is aggression.25,26 Based on the holistic understanding that many genetic variants with small individual effects might not meet sufficient thresholds for expression, it is possible that conjointly they may have an additive, stronger, and expressed effect.27
Our overall aim in the current study was to determine if and to what extent PRS could predict the tendency for aggression in a community sample of patients with SCZ. Our primary hypothesis is that higher PRSs for SCZ vulnerability influence aggressive behavior in psychotic disorders. The competing hypothesis is that other SCZ vulnerability genes are not involved in aggressive behavior.
Methods
Study Participants and Assessment
A total of 205 patients diagnosed with a schizophrenia spectrum disorder were recruited from the Centre for Addiction and Mental Health (CAMH) in Toronto, Ontario, Canada. This study was approved by the CAMH Research Ethics Board. Participants provided written informed consent for study participation and disclosure of their personal health records. Inclusion criteria included a diagnosis of schizophrenia spectrum disorder, the ability to provide informed consent, and age between 18 and 75 years. Each participant’s psychiatric diagnosis was confirmed by a medical chart review and the Structured Clinical Interview for the Diagnostic and Statistical Manual of Mental Disorders.28 Each participant subsequently underwent a cross-sectional assessment for the presence of lifetime physical aggression, verbal aggression, and aggression against property. Other information, such as age at onset of psychosis and duration of illness (DOI), was also collected. Aggression was assessed retrospectively by scoring the severity of the worst episode of documented lifetime aggression in participants' medical records using an adapted form of the Modified Overt Aggression Scale (MOAS)29 that covered lifetime verbal, property, and physical aggression. This adapted MOAS scoring scheme has been previously used and tested in our previous publications.17,30,31 Individual scores were assigned for each of the three violence categories on a scale from 0 to 4, with 4 being the most severe. History of physical violence, or any other violent action (e.g., verbal aggression or property destruction), was also defined as a binary variable based on a zero or nonzero physical aggression score.
Sample Collection and Lab Procedure
Venous blood was drawn and collected in BD Vacutainer Plus EDTA tubes (Becton, Dickinson, and Company). Genomic DNA was obtained from white blood cells using the QIAmp DNA Blood Maxi Kit (QIAGEN Inc.). The genotypes in the target sample collected at CAMH were obtained using the Illumina Omni 2.5 array.
Measures
The Childhood Trauma Questionnaire (CTQ) is a self-report questionnaire that can be administered to adolescents and adults to retrospectively assess five categories of childhood abuse: physical abuse, emotional abuse, sexual abuse, emotional neglect, and physical neglect.32 For the short-form questionnaire used in this study, participants were instructed to rate 28 statements on a scale from one to five based on how true they felt the statement to be (1 = never true, 2 = rarely true, 3 = sometimes true, 4 = often true, 5 = very often true). A respondent’s tendency to minimize or deny childhood abuse is measured by three of the 28 items to further validate the scale and improve reliability across different populations.
The Brief Psychiatric Rating Scale (BPRS) is a clinically administered 18-item questionnaire intended to assess the presence and severity of psychiatric symptoms such as psychosis, depression, and anxiety.33 Based on the interview and clinician’s impression of the participant’s behavior over the past two to three days, symptoms are rated on a Likert scale from one to seven (1 = not reported, 2 = very mild, 3 = mild, 4 = moderate, 5 = moderately severe, 6 = severe, 7 = very severe). Subscales for reality distortion, disorganization, negative symptoms, and anxiety/depression, as well as remission for symptom groups (including psychoticism, disorganization, negative symptoms, and global symptoms) are also measured with this scale. Because of its psychometric properties, the BPRS has been widely used as an instrument for clinicians to assess the symptomatology of psychotic disorders including SCZ.34
PRS Data Analysis
The PRS analysis aggregates the effects of variants across the genome to estimate heritability, to infer genetic overlap between traits, and to predict phenotypes based on genetic profile or that of other phenotypes.35 PRSs combine genome-wide genotypic data into a single score that measures genetic liability to a phenotype. The PRS is calculated from GWAS statistical test results, summing the number of risk alleles carried by an individual in the test sample, weighted by the effect size from the discovery GWAS, and can be easily calculated using the standard software PRsice.36 We used PRsice/1.25 to calculate PRSs in our study population.37 We calculated the PRSs using as a base sample the one analyzed by the Schizophrenia Working Group of the Psychiatric Genomics Consortium.38 The summary statistics and weight for the PRS calculations are freely available at https://www.med.unc.edu/pgc. The PRSs were calculated for all P value thresholds between .01 and .5 with a step of .01. We have used PRS P value thresholds that are the default option in the PRsice software. The software also provides the r2 for each P value threshold. In molecular genetics, a polygenic score (also called a polygenic risk score, polygenic index, genetic risk score, or genome-wide score) is a cumulative number that summarizes the estimated effect of many genotypes on an individual’s phenotype, typically calculated as a weighted sum of genetic polymorphisms associated to a trait in previous studies.
Results
Participant Demographics
Our sample consisted of 145 males and 60 females with an average age of 42.6 ± 13.0 years. The average age of onset of SCZ was 22.5 ± 7.9 years, while the average DOI was 21.7 ± 13.3 years. All participants were Caucasian. See Table 1.
Patient Demographics
Aggression
A lifetime history of aggression against property was seen in 70 participants (34.1%), with a mean severity score of .9 ± 1.4. A lifetime history of verbal aggression was seen in 113 participants (55.4%), with a mean severity score of 1.4 ± 1.5. A lifetime history of physical aggression was seen in 82 participants (40.2%), with a mean severity score of 1.0 ± 1.3.
Analyses of clinical correlates revealed that verbal aggression was associated with longer DOI (P = .003), older age (P = .033), and higher CTQ scores (P = .05). Physical aggression was significantly associated with longer DOI (P = .008), older age (P = .017), and higher BPRS scores (P = .05). Finally, aggression against property showed a trend with higher CTQ scores (P = .08). See Table 2.
Aggression and Violence Measures
PRS Analysis
Aggressive Behavior as Categorical Phenotype
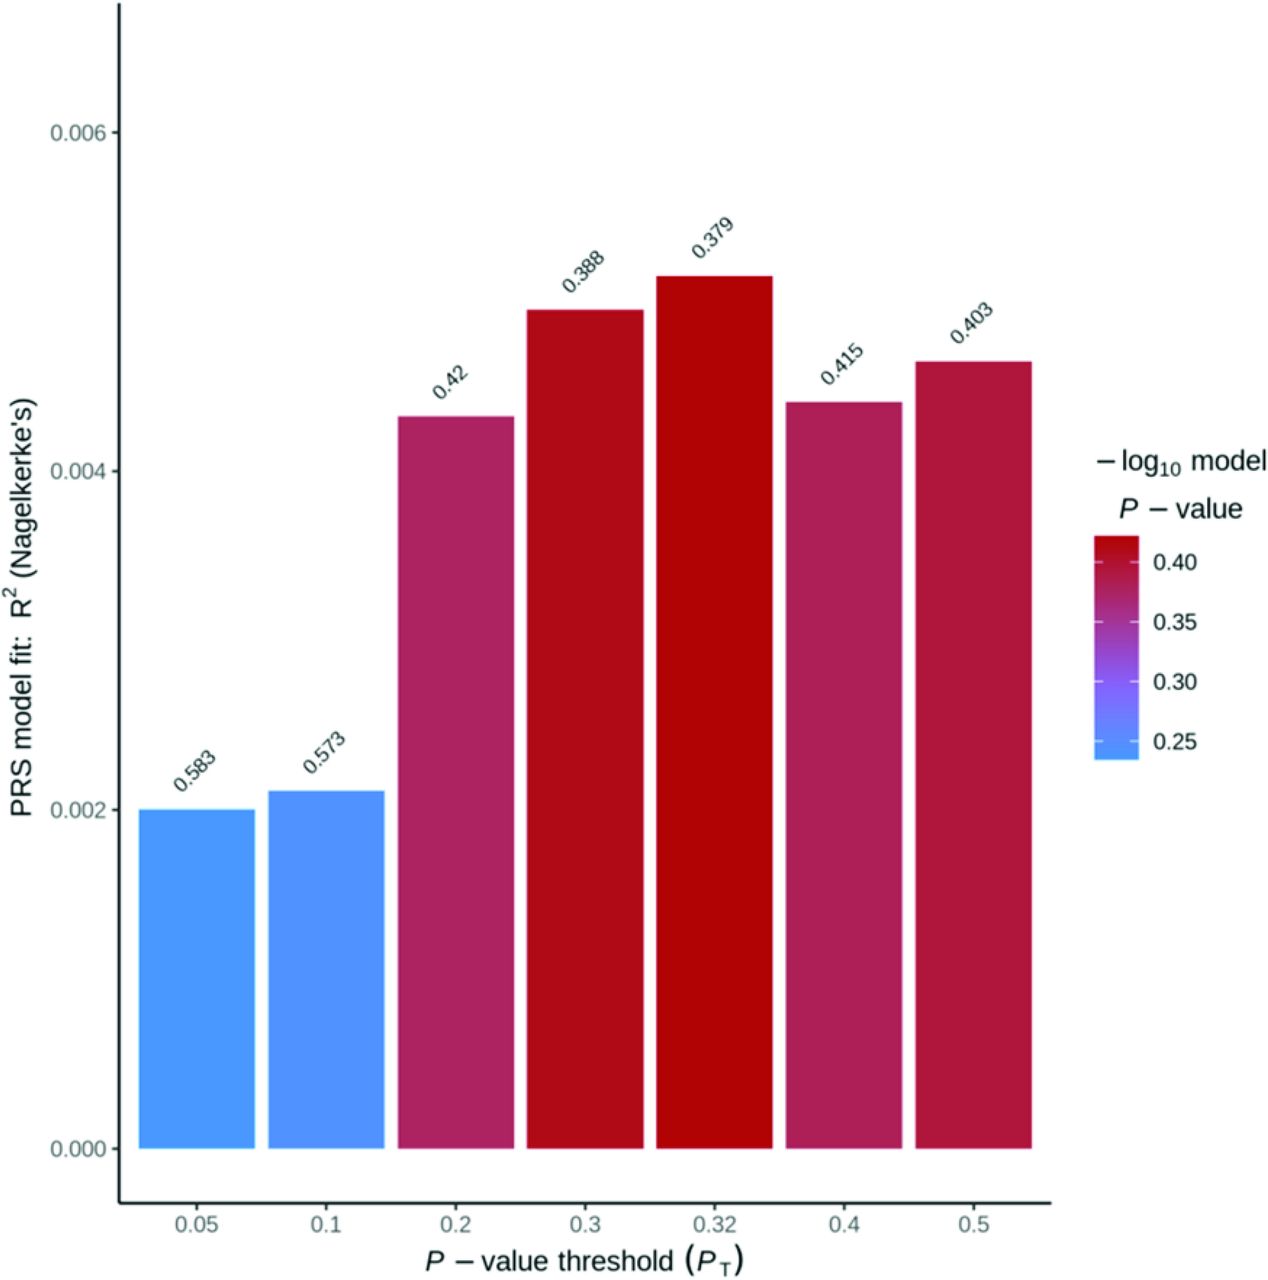
For this categorical phenotype analysis, we considered aggressive behavior as the lifetime presence (at least one) or absence of an episode of aggression. We did not find any association between the presence of lifetime physical aggression and the PRS for SCZ risk. The association between the PRSs and physical aggression was not significant for the following thresholds: .05, .1, .2., .3, .32, .4, .5. The highest r2 was .005 (P = .379) reported for the P value threshold at .32. The weighted PRSs for the threshold P values (< .32) ranged from .0114 to .0119 in our sample of 205 subjects (see Figure 1).

Physical Aggression Binary Polygenic Risk Score Analysis.
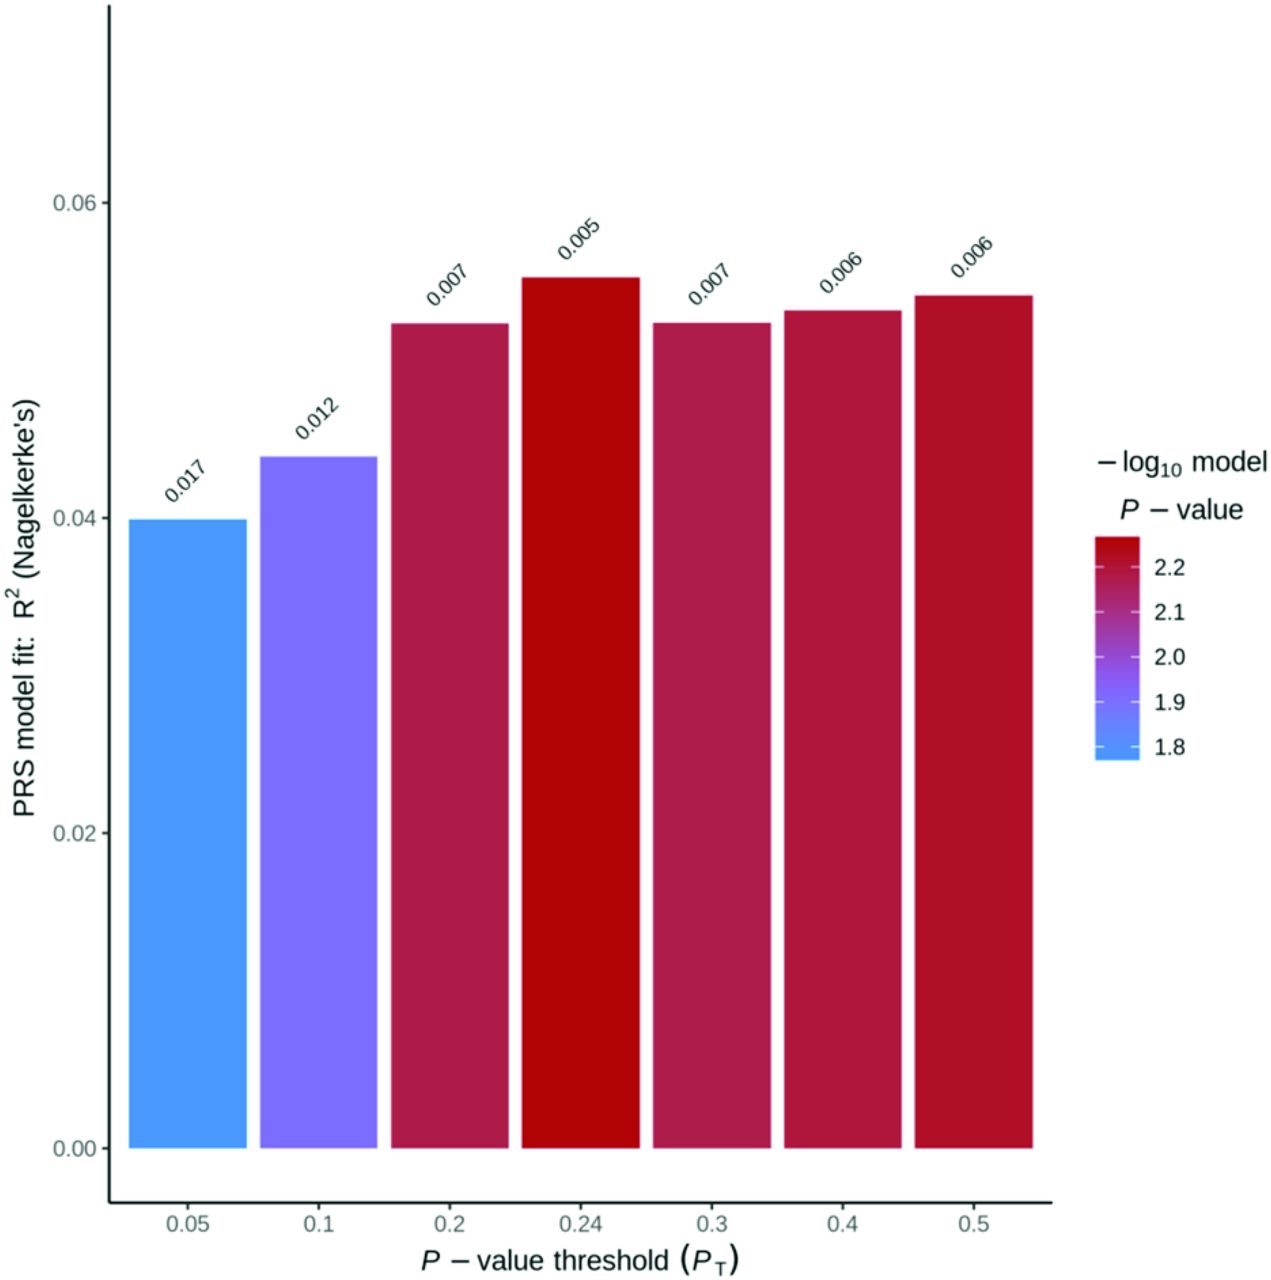
We also did not detect any association between lifetime verbal aggression and the PRS for SCZ risk. The association between the PRS and verbal aggression was not significant for the following thresholds: .05, .1, .2, .24, .3, .4, .5. The highest r2 was .027 (P = .044) reported for the P value threshold at .24. The weighted PRSs for the threshold P values (< .24) ranged from .0123 to .0129 in our sample of 205 subjects (see Figure 2).

Verbal Aggression Binary Polygenic Risk Score Analysis.
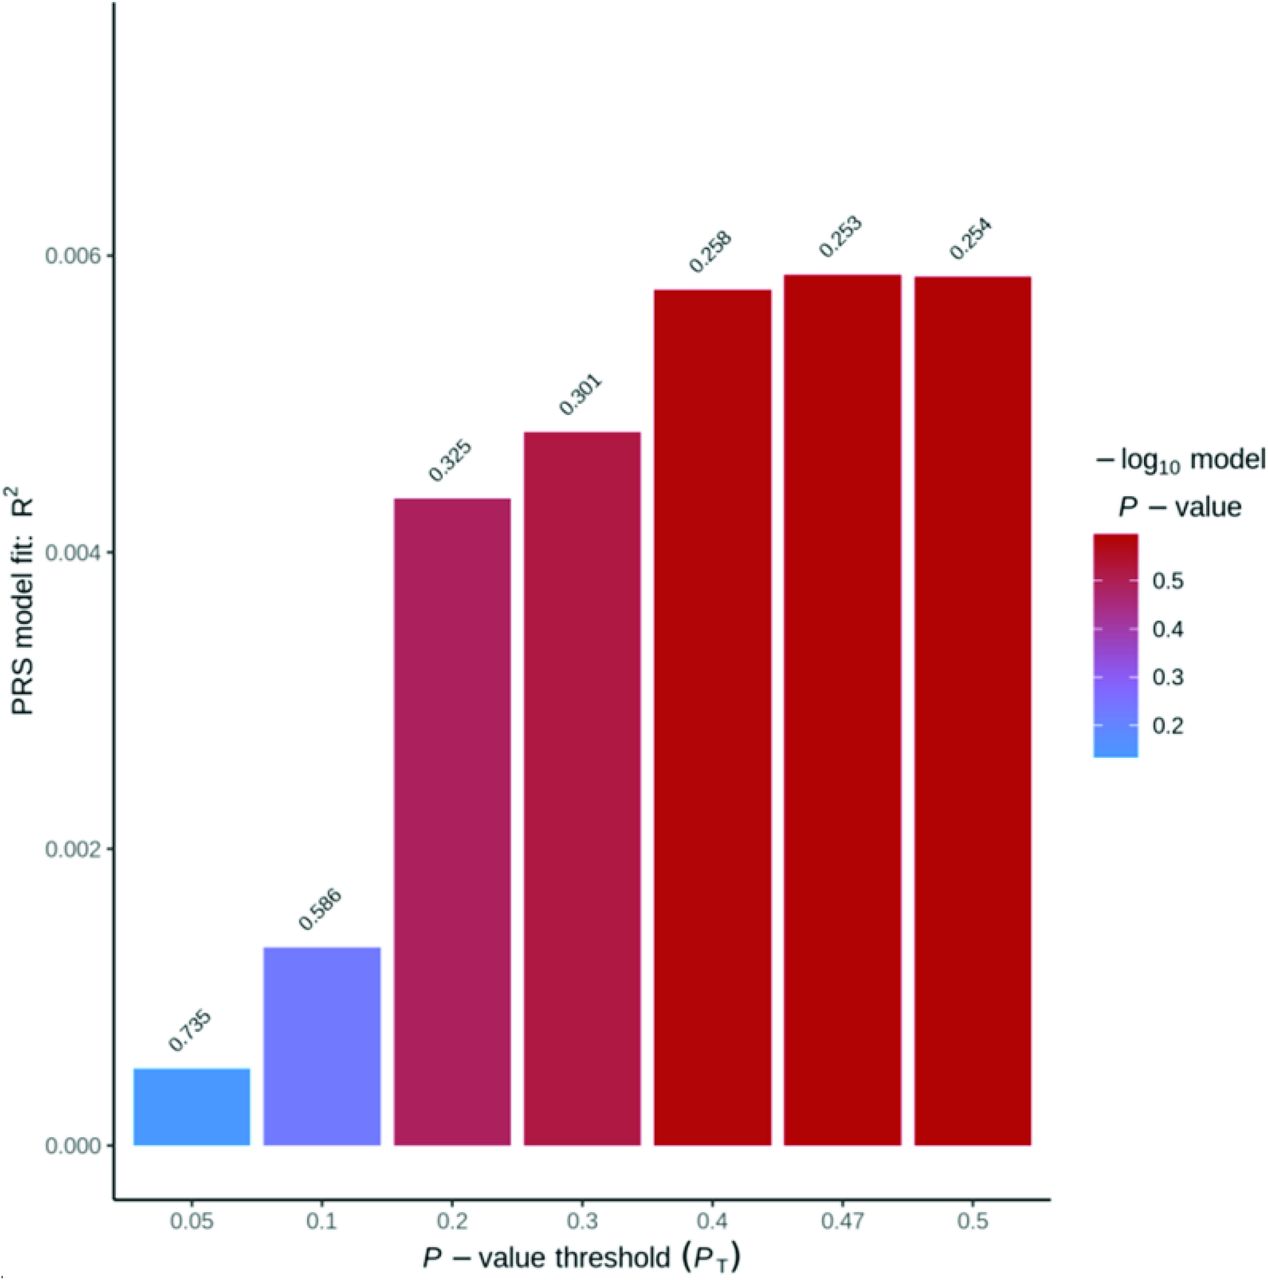
Finally, we did not detect any association between presence of lifetime aggression against property and PRS for SCZ risk. The association between PRSs and aggression against property was not significant for the following thresholds: .05, .1, .2, .24, .3, .4, .5. The highest r2 was .055 (P = .005) reported for the P value threshold at .24. The weighted PRSs for the threshold P values (<.24) ranged from .0123 to .0129 in our sample of 205 subjects (see Figure 3).

Aggression against Property Binary Polygenic Risk Score Analysis.
Aggressive Behavior as Continuum Phenotype
For this continuum phenotype analysis, we considered aggressive behavior as a quantitative phenotype, considering the severity score of the most serious episode of aggression during the lifetime. We did not detect any association between physical aggression scores and PRS for SCZ risk. The association between PRSs and physical violence was not significant for the following thresholds: .05, .1, .2., .3, .4, .48, .5. The highest r2 was .002 (P = .487) reported for the P value threshold at .48. The weighted PRSs for the threshold P values (<.48) ranged from .0100089 to .0103988 in our sample of 205 subjects (see Figure 4).

Physical Quantitative Aggression Polygenic Risk Score Analysis.
We also did not detect any association between verbal aggression scores and PRS for SCZ risk. The association between the PRSs and verbal aggression was not significant for the following thresholds: .05, .1, .2, .3, .4, .48, .5. The highest r2 was .006 (P = .267) reported for the P value threshold at .48. The weighted PRSs for the threshold P values (<.48) ranged from .0100089 to .0103988 in our sample of 205 participants (see Figure 5).

Verbal Quantitative Aggression Polygenic Risk Score Analysis.
Finally, we did not detect any association between lifetime aggression against property and PRS for SCZ risk. The association between the PRSs and aggression against property was not significant for the following thresholds: .05, .1, .2, .3, .4, .47, .5. The highest r2 was .006 (P = .253) reported for the P value threshold at .47. The weighted PRSs for the threshold P values (<.47) ranged from .0100878 to .0104826 in our sample of 205 subjects (see Figure 6).

Property Quantitative Aggression Polygenic Risk Score Analysis.
Discussion
Contrary to our hypothesis, PRSs were not predictive of physical aggression, verbal aggression, nor aggression against property. In this article, we considered the lifetime aggression as present or absent (binary variable) and also a severity index for the most severe episode of physical, verbal, or against property aggression (quantitative variable). None of these phenotypes were associated with PRS scores. Our findings contrast with previous research that found significant associations between SCZ PRSs, violence, and psychosis and irritability.36
A study by Ellis and colleagues39 produced results that contrast with our own, showing strong associations between SCZ PRSs and symptoms of violent and aggressive behavior. Their analyses included 5,160 participants and reported findings that were significant across all P value cutoffs, suggesting a high level of confidence in these results. It is important to note, however, that this study investigated the genetic overlap of symptoms between Huntington’s disease with risk for other psychiatric and neurodegenerative disorders; therefore, participants previously diagnosed with SCZ were excluded from the analyses. Hence, these findings may not be applicable to populations with clinical features of SCZ.
PRSs may be considered an estimate of the biological risk for SCZ, because of the large heritable component known to arise from variants with small effects.40 Therefore, future well-powered studies that build upon this initial investigation and examine different aspects of aggression, such as physical violence, verbal aggression, and aggression against property may help determine the clinical utility of using PRSs to predict violence in SCZ.
Regarding clinical variables, BPRS scores were positively correlated with physical aggression, and CTQ scores were positively correlated with verbal aggression and aggression against property. These findings were consistent with other studies; for instance, BPRS scores were suggested to be a predictive risk factor for physical aggression for psychiatric inpatients.41 Similarly, other studies have previously demonstrated a link between childhood trauma and violence in SCZ; for example, Storvestre et al.42 found that patients with SCZ who had a history of severe violence reported greater median CTQ scores for all subdomains when compared with their respective age- and sex-matched patients with SCZ who did not have a history of violence and to healthy controls. This was further corroborated by another study, which found a significant association between the physical neglect subdomain of the CTQ and patients with SCZ who had committed or attempted homicide compared with nonviolent controls with SCZ.43
In terms of demographic correlates with aggression, this study found that longer DOI and older age were associated with verbal and physical aggression. This is in concordance with the findings of Imai et al.44 that increased DOI was associated with violence in SCZ. Similarly, Tesli et al.45 reported that patients with SCZ who had a history of violence had a greater mean age than patients with SCZ who did not have a history of violence.
We note several limitations of our study. Most importantly, our sample size was modest, encompassing 205 individuals. Seventy patients displayed a lifetime history of aggression against property, 113 patients endorsed a lifetime history of verbal aggression, and 82 patients displayed a lifetime history of physical aggression. These data provide an estimate of rates of aggressive behavior in a nonforensic sample of patients with SCZ. It is possible that the lack of conclusive genetic evidence may be partially attributable to the heterogeneity in aggressive behavior; thus, there may be a wide range of genetic variances and mechanistic differences linked with the frequency and degree of aggressive behaviors. Our study was also composed of nonforensic, community-dwelling individuals with SCZ with overall low levels of violence. It is possible that results would have differed in forensic samples of SCZ, where patients would be expected to have higher levels of aggression. Based on a national survey, which found that the prevalence of outpatients with SCZ with aggressive behavior was 15.2 percent, and the sample estimate of 15 percent in our study population, the sample size needed to detect a difference in aggression using a categorical model with 80 percent power and alpha = .05 would be n = 470.46 This is greater than our current sample size, and future works may benefit from replicating this study design with more participants to adequately detect an association between PRS and aggression in SCZ. In addition, this study did not stratify participants based on demographic features or perform any subgroup analyses, which future studies on this subject may benefit from. The other limitation is that we have conducted a chart review, and we did not perform an interrater reliability analysis.
In addition, violence was operationalized as lifetime aggression and it could have preceded the onset of SCZ, thereby limiting the interpretation of the predictive relationship of this analysis. Furthermore, we have combined all levels of physical violence as one category that may have contributed to the heterogeneity of the phenotype. For determining lifetime aggression in this study, we reviewed the chart and used a scoring similar to the MOAS. Therefore, the retrospective nature of this assessment is a limitation of this study. Participant interviews that assess violence and aggression may be more sensitive to quantifying these outcome measures.
Another confounding factor is that we have analyzed aggression across the entire lifespan without differentiating between childhood, adolescence, or adulthood. On the other hand, considering that the onset of SCZ is in late adolescence and early adulthood, it is likely that the aggression index is mainly in adulthood. Another possible explanation of the negative results of this genetic study is the fact that we had patients with schizoaffective disorders, which may have complicated the analysis and contributed to the sample heterogeneity.
Conclusion
In conclusion, the genetic risk for SCZ warrants further analyses, particularly in investigating the additive or protective effects of minor alleles. Although our study did not yield significant results in terms of the PRSs, we view our work as an initial step for analyses that consider forensic psychiatric patients with SCZ. Furthermore, assessing the genetic risk for SCZ holistically may allow us to better understand the propensity toward violence and aggression associated with schizophrenia spectrum disorders. This endeavor calls for larger studies with more detailed analyses of PRSs, as well as taking into account other early life adversities that play a role in predicting, understanding, and preventing aggressive behavior. Furthermore, large multicenter genetic studies of violence with more demographic and clinical variables can provide more informative results. Finally, despite the study limitations, the fact that we did not find an association between genetic risk and aggression in SCZ might also suggest that such links, indeed, do not exist.
Acknowledgments
This research was funded by a research grant awarded to NJK from the American Academy of Psychiatry and the Law Institute for Education and Research.
Footnotes
Disclosures of financial or other potential conflicts of interest: None.
- © 2023 American Academy of Psychiatry and the Law


